How to crack mac apps hex
In order to follow along you're going to need a few command line utilities. You're going to need the Xcode tools installed. And, lastly, you're going to need an app to operate on. I chose Exces , a shareware App I wrote a long time ago. Let's start by making sure we have the two utilities we need: I like to use Homebrew as my package manager of choice.
Note that I will use command line utilities only, including vim. The first step is to poke into the target app's headers, gentlemanly left intact by the unwitting developer. What do we have here?! A badly spelt variable and what looks like three methods related to registration. We can now focus our efforts around these symbols.
Let's continue poking by disassembling the source code for these methods. Note that Exces is a universal binary, and that we need to ensure we only deal with the active architecture. In this case, Intel's i Let us find out what verifyLicenseFile: This is not straight Objective-C code, but rather assembly-what C compiles into. With this in mind, we can realize that verifyLicenseFile: We can guess that verifyPath: We can see from the header that verifyPath: We need something that deals in booleans.
No bite. The breakpoint is not hit on startup. We can assume that there's a good reason why verifyLicenseFile: While we could patch verifyLicenseFile: Quit gdb and let's instead search for another piece of code that calls verifyPath:. In the otx dump, find the following in awakeFromNib:. Since awakeFromNib is executed at launch, we can safely assume that if we override this check, we can fool the app into thinking it's registered.
The easiest way to do that is to change the je into a jne, essentially reversing its meaning. If we simply switch the binary code for the je to , at address c9c, we should have our crack. Let's test it out in gdb. We break on awakeFromNib so we're able to fiddle around while the app is frozen. Now here's the confusing thing to be aware of: While on disk, the binary code is normal, intel is a little-endian system which puts the most significant byte last, and thus reverses every four-byte block in memory.
We recognize the first two bytes from earlier. We need to switch the first two bytes to Let's start by disassembling the method so we can better see our way around. Find the relevant statement:. Here we set the first byte at 0xc9c. By simply counting in hexadecimal, we know that the next byte goes at address 0xc9d, and set it as such. Let's disassemble again to check if the change was done right.
We should only have changed 74 to 75, and not 09 to Let's fix our mistake. We're in, and the app thinks we're a legitimate customer. Time to get wasted and party! I recommend Vessel nightclub in downtown San Francisco. Instructions are going to look different if you are using a 32 bit or a 64 bit machine - but you can figure it out. The next tool on our list is nm. According to its man page, nm is a tool that will "display the name list symbol table of each object file in the argument list". What does that mean?! Let's just run it against our target and find out hey?
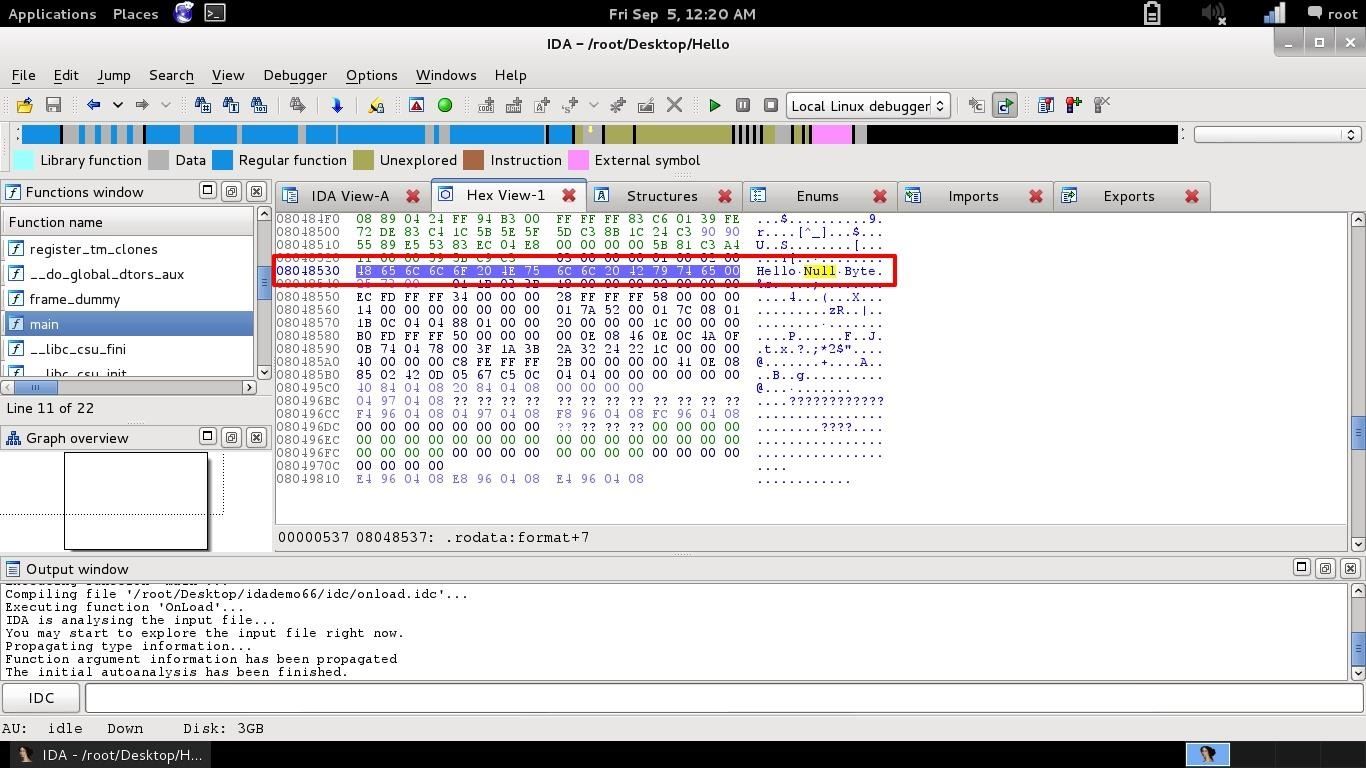
Whoa boy, looks like hacking got lots easier since the 90s!
We get a list of every method and property in the executable - including seductive names like verfiyLicense , isLicenced , and setIsLicensed. Well, there goes the "divining" part of this exercise - might as well get on with the hacking. I'm assuming that not every binary is going to be loaded with symbols, so we'll just call this beginners' luck: Now is a great time for you to check out a couple out of binaries for yourself.
Try a bunch of different apps: Pick something interesting, then read on Handy hint: For example: You can also open it straight up in Textmate if you use it with mate.
Names can be deceiving, so next we'll disassemble the target and have a squiz at some machine code. Not as nice to read as CoffeeScript, but prettier than binary. To make things a little easier on the eye, try using the otx tool - it uses otool under the hood, but does some "demunging" of names and makes the code more readable. Even so Your best bet is to just dive in and start looking around.
Dodgy machine code primer: The first number you see on each line e.
MacUpdate.com uses cookies.
Values are can be pointers to memory locations, or simple integer numbers. Registers are like variables: Finally, instructions are the low level commands that all programs are made from: If you write a small program in C, then disassemble it you'll start to thank your lucky stars we don't have to do all our programming in assembler. So we have a few method names that are interesting to us. I personally like the sound of this isLicensed method - it has a boolean result You can check this if you disassembled with otx or if you run the file through class-dump so it's likely that we can apply the age-old.
Unfortunately, searching for all the occurrences of isLicensed easiest to see in the otx output shows that this method is called in a few different places - and that means we'd have to patch them all. Additionally, if we apply this type of crack the program will never set itself as "registered" - it just gets tricked when it goes to kick us out. A quick once-over of the verifyLicense method doesn't look good: My assembler is rusty at best - but this lengthy bit of code is comprised of a whole bunch of string manipulation, calls to crypo libraries and private keys and But this is most certainly the place to be if you wanted to create a keygen - you'd just have to figure out what every call did and how it calculates the correct results.
In the end I decided to combine the Fravia "code feeling" approach with my own personal "laziness" approach: Sure, the program is not reeealy cracked, but then we only have to patch one place - and as long as the popup message is gone, who cares? You'll have to make these kind of decisions on a target-by-target basis: Enough of this dead list reading - it's finally time to fire up the debugger and test out our ideas on the running program.
A debugger like gdb will load and run an application, but lets you stop the execution any time and examine the current state. The host program doesn't even realise that time has stopped - so you can poke and prod, changing memory values and machine code instructions!
Mr Speaker
When you continue the program running, all your changes are still in memory. Very cool. What's going on? Well, our debugger loaded the program up and has now stopped it at the very first line of machine code. It awaits our command. The most common thing to do is try and set breakpoints near the interesting bits of code we identified earlier.
Synalyze It! - more than a Hex Editor for Mac OS X
If the program stops when you think it should stop for example, it would make sense that isLicensed should get called just before a popup opens then you know you are in the right place. So set a breakpoint on the isLicensed method that we found above. You need to plug in the entire name - not just the method name:. At least the debugger knows about this function: With our initial breakpoint in place, we can run the program with the r command and see if we hit it.
For Spannr the popup box happens as the program loads so hopefully we'll get dropped back into gdb before we see the UI appear:. Oh bingo! The program started running, and then someone made a call to isLicensed - so our debugger stopped everything at memory location 0xbb. We have frozen time right at the start of the isLicensed function! Let's have a look around. If the breakpoint you chose doesn't fire on start up, then the program should load as normal. It's up to you to get the breakpoint to trigger - perhaps you'll have to open the "registration" menu item, or even just use it for a while.
If you can't get it to trigger, then it's back to the drawing board.
How I'd Crack Your Mac App
You'll have to try a different breakpoint. Now that we've gone all Matrix-y and stopped time, we can have a look at the instructions that live at the current memory location by using the disas command. This will "disassemble" the bytes that make up the program into machine code, as we did above. If you use disas on its own, it will disassemble from the current instruction, but you can also supply a different address if you want to see what other bits of code look like. Wow, that is a very, very small function.
Just a few instructions long - that should work in our favour. We can also look at the state of the registers as we've entered the function with info registers:. There are a dozen or so registers - but we'll only be concerned with the register eax. The eax register is a bit general-purpose register that commonly stores the return value of a function. That sounds relevant to our interests. That means there are actually only 2 real instructions in this function before it exits! We can step over those two instructions with the nexti ni for short command.
This will cause the program to execute the instruction that eip points to.
If we do it twice, then we are effectively at the end of the function - and can examine the registers again:. Well there's your problem sonny And a zero, as we all know, means "false". Obviously we need change the eax value to a 1. First, restart the program by entering r - this will get us back to the breakpoint at the start of the function.
Again, step over our 2 instructions with ni. Now we can change the eax register:. Ohh, looks good. Now continue running the program with the c command: But don't get too excited - if we exit the program, restart it in the debugger, step over the two instructions again and have a look at the registers - oh, it's back to 0.
Having to manually change the value every time is a bit more annoying than clicking away a popup - so we have to figure out a way to make our changes in code. This bit is going to be tricky if you don't know any x86 assembler. You don't need to be an expert - but it helps to know some basics. For this program I know vaguely what I need to do: I need to get the value 1 into the register eax.
How Do People Crack Computer Programs And Games?
This should look something like this: But how do I get put this command into the code? I have no idea. In the olden days the debugger I used was called SoftIce and you could just flip into assembler mode and write the code. But I don't know how or if you can do this with gdb. My only alternative then was to find out what the disassembled version would look like in bytes: So I scoured the dead listing from otx we did earlier until I found one! That's him, officer. The first column is the "line number" and the second is the decompiled bytes we need: That's 5 bytes right there that we need to insert into the existing code.